STEP 1
Turning 12 Dense Documents into Visual Flowcharts
The first task wasn't design at all. Each of the client's 12 service documents was translated into a visual flowchart, so the team could see the shape of a process — who does what, in what order, and where a decision point sits — instead of reading it as pages of written procedure. In hindsight, this stage turned out to be the more straightforward part of the project: it built a shared, visual understanding of processes that until then had only existed as text.
STEP 2
Wireframing the Skeleton: The Hardest Part
Before any visual design began, every flow was broken down into a wireframed skeleton, mapping not just the primary path through a service, but every branch it could take. Fit-Out Design is a representative example: a design submission isn't a single form and a confirmation screen. It's a form, followed by a review that could be approved, rejected, or sent back with change requests, each outcome needing its own screen state and its own path back into the flow, layered with the multiple levels of approval the process actually required.
Multiplied across 34 flows and 12 service areas, working through every case not just the happy path was the most demanding part of the project, well before a single screen was styled.
STEP 3
Validating Every Flow With the Right Stakeholders
Each service area sat with a different part of the client's business, leasing, fit-out, permits, finance and operations each had their own stakeholders and their own view of how a process should work. Rather than finalize flows internally, the team ran dedicated working sessions with each stakeholder group, walking through the wireframed skeleton service by service, resolving disagreements, and confirming edge cases together. A flow only moved into visual design once it had been signed off in these sessions — which meant the design phase started from a structure the client's own teams had already agreed to, not one the design team was hoping would land.
What the 12 Confirmed Service Areas Cover
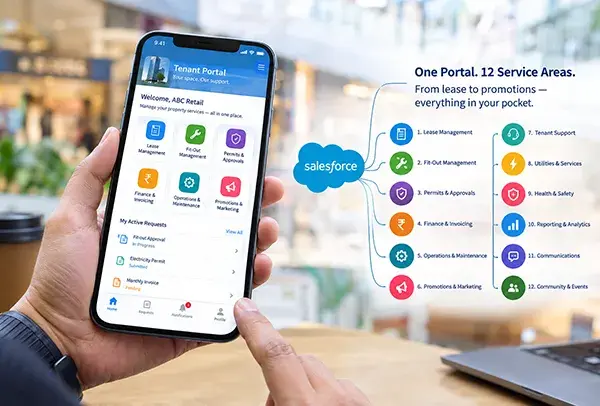
The result of that flowcharting, wireframing and validation work was 34 documented, end-to-end service flows across 12 service areas — each one designed as a full journey from tenant-initiated request through to resolution, not just a single form:
| Service area | What it enables for tenants |
|---|
| Profile Management | Manage business profile, contacts, documents and compliance renewals. |
| Lease Management | Access lease documents, request renewals or variations, resolve outstanding dues. |
| Fit-Out Initiation | Kick off the fit-out journey, submit applications, appoint the project team. |
| Fit-Out Design | Submit and track design, MEP and variation requests. |
| Fit-Out Site Work & Delivery | Request NOCs, access permits, inspections and pre-opening sign-off. |
| Fit-Out Completion | Complete Permission to Trade and initiate deposit reimbursement. |
| Fit-Out Support | Request safety inductions and support sessions with the relevant team. |
| Permits & Approvals | Submit and track access permits and No Objection Certificate (NOC) requests. |
| Financial Services | View accounts, invoices and payments; request payment modifications. |
| Operations & Maintenance | Report and track common-area facility issues to resolution. |
| Sales Reporting | Submit sales figures and access sales analytics. |
| Promotions & Campaigns | Book event spaces and request campaign or advertising participation. |
STEP 4
Step 4 — A Design System Built for Salesforce, at Scale
Only once flows were validated did the work turn visual. Rather than treating each service as its own design problem, the team built a shared design system typography (Montserrat), a structured colour palette, spacing and corner-radius rules, and a consistent iconography set , so that consistency, scalability, responsiveness and accessibility held across all 12 service areas.
On top of that system, the portal's UI was built from a hybrid component library:
| Component type | Count | Role in the portal |
|---|
| Salesforce / SLDS components | 24 | Standard navigation, forms, actions and feedback patterns — keeping the portal aligned with native Salesforce behaviour. |
| Custom Dubai-market components | 75 | Purpose-built headers, dashboards, cards and service-specific patterns the standard library didn't cover. |
| Total reusable components | 99 | A shared library that lets new services be assembled from existing parts rather than redesigned from scratch. |
Designed for the Way Tenants Actually Work
The full portal, Home dashboard, Level 1 pages,all 12 service journeys and the supporting component library was designed as responsive experiences for both Desktop and iPad, reflecting how tenants and on-site teams actually access the portal, rather than assuming a single device context.